Why Choose Aerial Infrared?
Infrared wildlife population surveys are one of the most efficient ways to quickly identify and count a variety of animal types within normal forest, rural, and suburban habitats. With the help of specialized mapping software, we can accurately locate and count these populations.
When conducting wildlife population surveys, we count populations by placing dots (representing the specific animal) on a map in their respective positions and orientation to one another and their environment. By becoming familiar with the environment, we are also able to determine their exact location in relation to nearby streets, intersections, rivers and streams.
Frequently Asked Questions (Deer Surveys)
How do you know you are not counting the same deer twice?
- Deer are not disturbed by a light plane flying more than a quarter of a mile above them
- Deer often congregate in groups of two or more – up to 20 or more in extreme cases
- Deer generally move very slowly as they graze, congregate or rest
- Deer live and act according to generally well known behaviors
- We fly along a well documented flight path with an ‘infrared view’ of a known area below the aircraft that is recorded on videotape.
How do you know what you are seeing and counting are deer, not some other animal?
- There is usually a sizable quantity of deer in the area in which we are flying the deer count
- There are other wild and domestic animals in the same area, usually in smaller numbers
- Deer don’t climb trees
- Deer are somewhat ‘brazen’ in their occupation of human communities, domesticated animals are often corralled, fenced in, densely grouped or tethered
- Deer are notably larger than foxes, raccoons, skunks and many dogs and smaller than cows and horses.
- Deer have a variety of apparent temperature ranges/thermal signatures but are nearly always cooler than common domestic animals (dogs, horses, cattle, sheep)
- Skunks, raccoons, and foxes appear to have warmer apparent body temperatures than deer and often look like a bright pinpoint of light in the woods, whereas a deer is larger, usually cooler and with less distinguishable edge contrast with their surroundings (i.e., they look slightly ‘fuzzy’ around the edges).
- Deer congregate more and move less, and generally less rapidly, than smaller nocturnally active wild animals such as skunks, raccoons, coyotes and foxes.
How accurate is the count?
We believe an average of 90% is in the ballpark, perhaps better, sometimes worse. Conventional methods (deer-car collisions, spotlighting, pellet counts, deer tracks) are considered to be accurate within 30 to 40 percent – not a high number. In this method, we are looking at 100% of the area in question and under good conditions all active deer not hidden from view should be seen and counted with infrared.
Equipment, Flight Methodology & Analysis Methodology (Deer Surveys)
Our experience conducting wildlife population surveys has given us high confidence in identifying deer in their normal forest, rural and suburban habitats. The deer that we have difficulty identifying and counting are those that are partially hidden from view in evergreen vegetation, or those exhibit such a low apparent temperature (thermal signature) that we cannot see them or distinguish them sufficiently enough to identify them as deer. We do not count ‘white dots or blobs’ that we do not have a strong feeling are deer.
Close examination of most infrared deer count videotapes will reveal to the viewer quite a few animals in trees or on the ground that do not appear on the deer count map. These animals are most likely to be something other than deer. Our deer counts are generally considered a minimum definite number – as opposed to a maximum, possible number. Some deer will go undetected in nearly every environment.
To count during our wildlife populations surveys, we watch the entire tape, pausing and playing it backward and forward at regular speed and in slow motion as necessary. Generally, for each hour of tape, three or more hours of analysis and reporting are required to complete the count. As we view the tape and note the deer, we mark each one as a dot on a computer version of the maps accompanying this report. When we have viewed the entire tape, we count the dots on the map to find the number of deer in the count area. If we note large domestic animals on the computer map, we mark them with a different color dot. In these counts, red dots denote deer, gray or yellow dots (if any) denote possible deer or other unknown animal similar in size to a deer but apparently not a deer and blue dots (if any) represent domestic animals such as cattle, sheep or horses. These animals are always much warmer and in the case of horses and cattle, substantially larger than any deer.
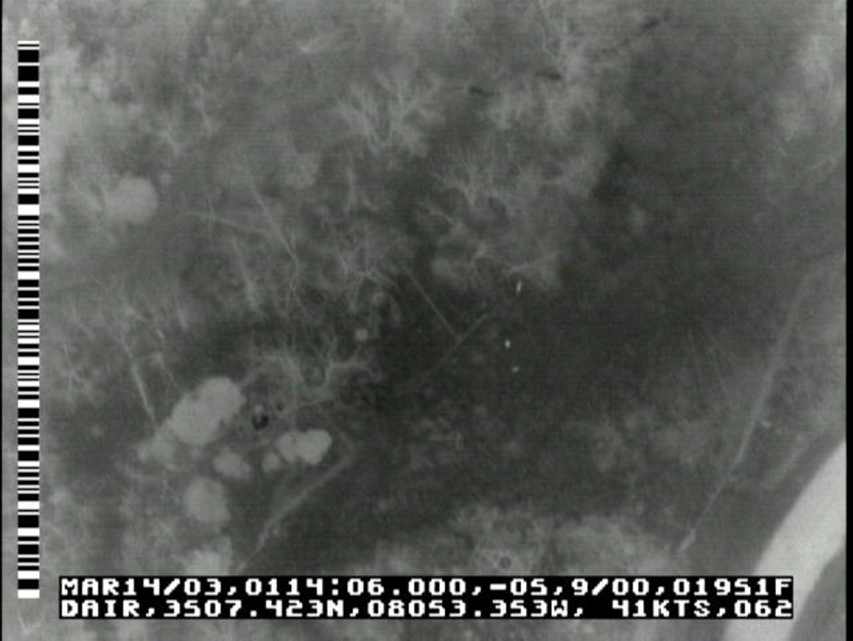
Deer usually appear as a fairly bright white dot or narrow line (similar to a grain of rice) in the infrared imagery. In this imagery, white and lighter shades of gray represents warmer objects while black and darker shades of gray are cooler. Other white (warmest in the scene) objects that are common are roads and pavement that retain latent heat from sunshine during the day, man hole covers, street lights, house lights, fires, furnace stacks on houses, car engines that are running or have run recently, groundwater seepages, puddles, ponds, streams, rivers and large rocks and boulders in the woods. Other animals in the picture are often white or bright. Domestic animals are commonly very bright – hotter than deer, which have highly insulating coats.
Sample Aerial Infrared Deer Count Report
The Example Parks listed below were the subjects of an aerial infrared (IR) deer count flight on the dates noted. The IR imaging conditions were good to excellent during both nights. Additional details of these wildlife population surveys be found in the analysis notes below.
This report package includes this written report, VHS videotapes of the raw infrared imagery of the count areas, map printouts of the deer count and dispersion within and near the count areas and a copy of each map in .jpeg format on CD-ROM. Deer, possible deer and domestic animals are noted on the maps by dots of different colors. Deer are red, possibles are gray or yellow and domestic animals such as horses or cattle are dark blue. The dots representing animals cover an area approximately 30 to 40 feet in diameter on the maps so they can be seen and printed easily.
Animal Count Example Park 1
The aerial infrared imaging flight for Example Park 1 was conducted between 2248 on 26 December and 0045, 27 December 2001. Imaging conditions were good. Surface winds were from 220 degrees at seven miles per hour, with winds at the imaging altitude of 1500 feet above ground level (AGL) from 250 degrees at ~15 mph. The ground was covered with 2-4 inches of snow that was about two days old. Average air temperature was –7 deg. C. The cloud ceiling was broken at 9000 feet AGL, with two scattered layers below. A very light snow was falling during portions of the flight and there was light to moderate turbulence from beginning to end.
Animal Count Example Park 2
The infrared imaging flight of Example Park 2 was conducted between 2255 on 31 December and 0128, 1 January 2002. Imaging conditions were excellent and small animals were easily visible on the ground and in the trees. Surface winds were initially from 210 degrees at five miles per hour, later changing to 200 at 10 mph. Winds at the imaging altitude of 1500 feet AGL were WSW at about 10 mph. The ground was covered with a few inches of snow that fairly fresh. Average air temperature was –9 deg. C. The sky condition was clear with no turbulence.